How Salt Security Scaled Kafka Streams to Secure Billions of API Calls

This is a guest post in collaboration with Omer Aharonian, a Staff Software Engineer at Salt Security. Omer is a seasoned software engineer with extensive experience in backend development, data engineering, system architecture, and leading R&D teams.
Salt Security is the industry leader in API security, providing a comprehensive solution that governs and protects your APIs throughout the entire API lifecycle. The Salt platform discovers API endpoints, assesses risk, identifies posture gaps, and detects even the most sophisticated attacks.
In this blog post, I’ll explain how we at Salt identified and solved a major bottleneck in one of our most critical systems and share the lessons we learned along the way.
System Visibility - A Bookkeeping Challenge
Modern digital systems are complex and ever-changing, with countless interconnected components handling various types of data exchanges. From small applications to large-scale enterprise platforms, tracking these interactions, their versions, structures, and other critical details is a significant challenge.
At Salt Security, we help organizations overcome this hurdle by automatically and continuously mapping these interactions to create a comprehensive inventory of all operational elements. Customers rely on this inventory to:
- Search and filter system components.
- View important metadata, such as communication protocols or underlying frameworks.
- Assess potential security risks associated with specific elements.
You can think of this System Inventory as a catalog of all interactions between a service and users of that service. By tracking “normal” interactions, Salt’s advanced security platform can rely on the System Inventory to identify when interactions are suspicious.
However, building this inventory once is not enough. Digital ecosystems are dynamic—new components emerge, existing ones evolve or become obsolete, security postures shift, and access permissions change. Keeping this inventory continuously updated is an ongoing challenge that requires automation and intelligent monitoring.
Keeping The System Inventory Up to Date with Kafka Streams
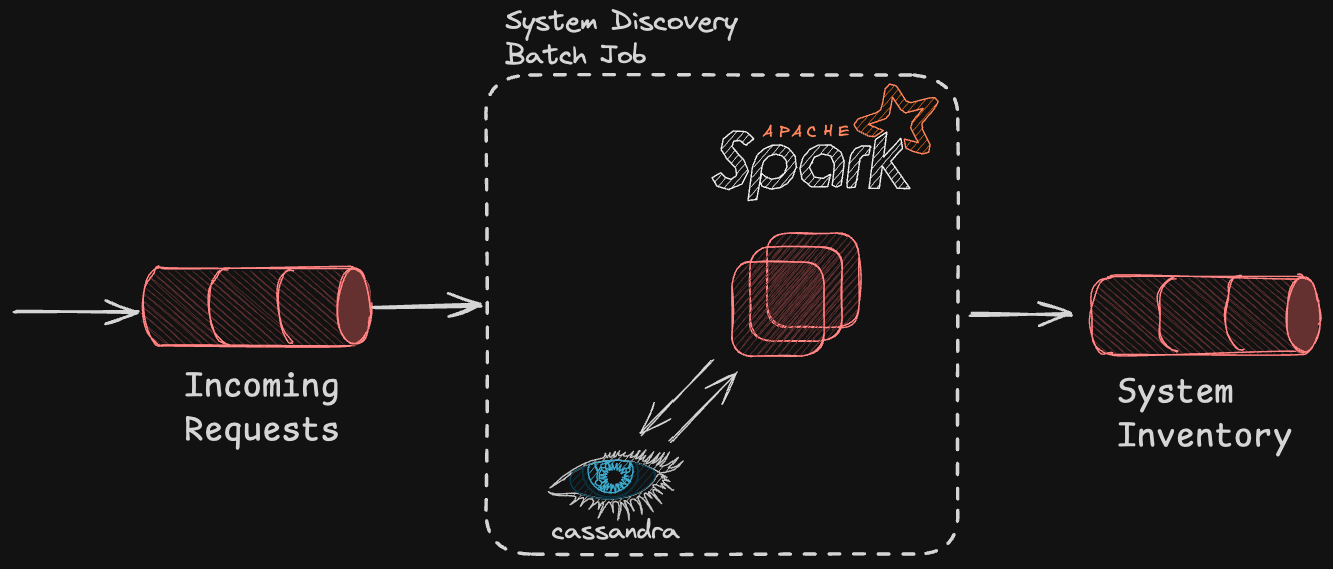
In Salt’s early days, tracking system interactions was handled through a batch job running over an Apache Spark/Cassandra cluster. However, as our platform scaled, the implementation grew increasingly complex, and the volume of data being processed expanded exponentially. Over time, the batch job struggled to keep up—jobs began failing frequently, and even successful runs took hours to complete. This led to inaccuracies in our System Inventory, which in turn affected downstream processes that relied on it.
We realized that to maintain an accurate, real-time view of system activity at scale, we needed to rethink our approach. A more efficient, event-driven architecture was required to ensure continuous, reliable updates without bottlenecks.
From Batch to Streaming
One of the most important requirements of our inventory is to stay up-to-date and reflect changes in the system as soon after they happen as possible.
Batch processing is clearly not a good fit for this requirement: it sacrifices latency in order to improve throughput by accumulating data over an amount of time before processing it. Even if we compensated for this by running the batch job every couple of minutes, the high volume of traffic we had to deal with meant that it would still have to deal with millions of records and still take too long to complete.
It was clear we needed to go for a faster processing architecture that happens continuously, or in other word: stream processing.
Kafka Streams? Spark Streaming? Flink?
The ecosystem of stream processing is vast and full of options, so we decided to define a set of requirements and choose the technology that answers most of them.
Our main requirements were:
- Performance and Scalability
- Ease of deployment and maintenance
- Maturity and community
These requirements lead us to consider both Flink and Kafka Streams. While both answered all of our main requirements, Flink required maintaining an additional cluster, whereas Kafka Streams only needed a Kafka cluster, which we already had. So… Kafka Streams it is!
Breaking the Beast
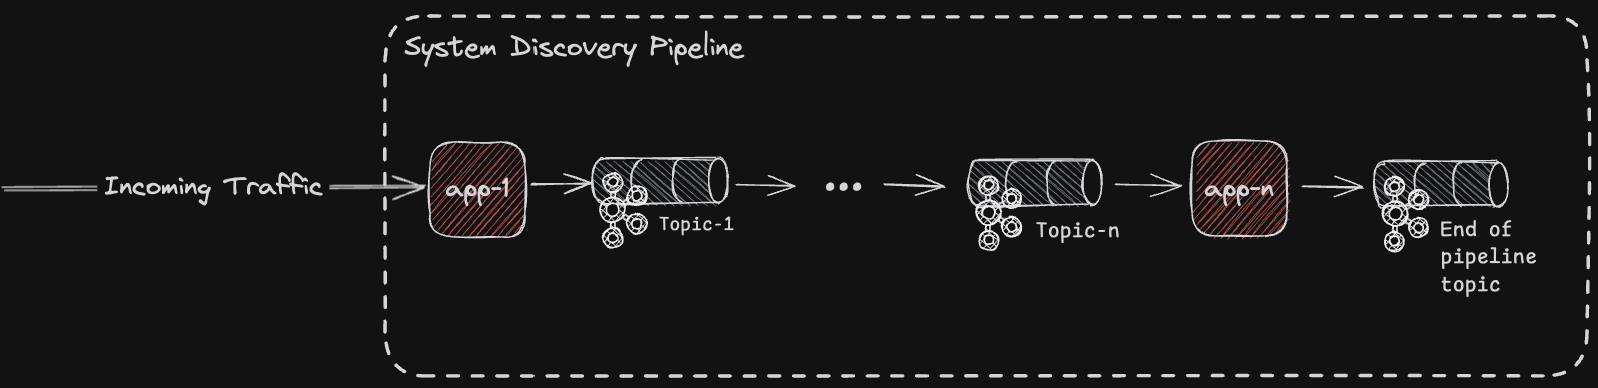
Learning from previous mistakes, we decided to go for a more modular approach and implement the system discovery process as a pipeline of applications, each in charge of a very specific part of the process. The main idea was to break down a very complex task into a set of smaller sub-tasks (applications) that are easier to reason about, and can be configured and scaled based on their unique needs. For instance, while one application runs only stateless basic processing of the incoming customers’ traffic (and thus works perfectly fine with a handful of replicas), another application might have to run heavy stateful statistical computation and require many replicas to keep up with the high volumes of traffic being ingested into the pipeline.
This pipeline of Kafka Streams applications runs on top of Kubernetes, with each application having a dedicated set of relevant configurations, such as CPU/memory limits, HPA and so on.
With an extensive set of monitoring dashboards (covering both our own custom metrics and various jmx metrics exported by Kafka Streams) we were good to go.
And indeed, the new pipeline was working much better than the old batch job: we experienced significantly fewer failures, and were able to discover changes in our customers’ System Inventory blazingly fast!
Initially, everything was going smoothly and changes in the system got reflected in the System Inventory within minutes since they took place, but as we began onboarding more new customers onto our shiny new pipeline, things have started to change…
When Things Start to Lag
The first thing we noticed was a degradation in the accuracy of the System Inventory. In some cases, it took the inventory longer than usual to reflect changes in the system. In some cases, it took the system 1-2 hours to reflect changes, in other cases, the changes failed to be reflected at all, leaving the System Inventory (potentially) outdated.
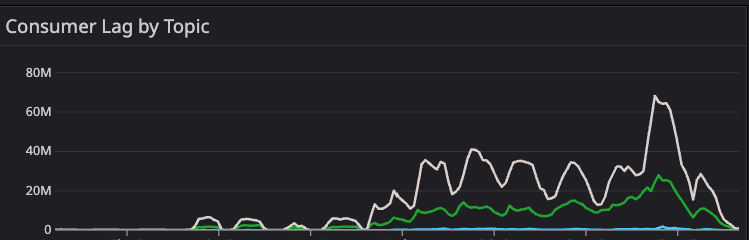
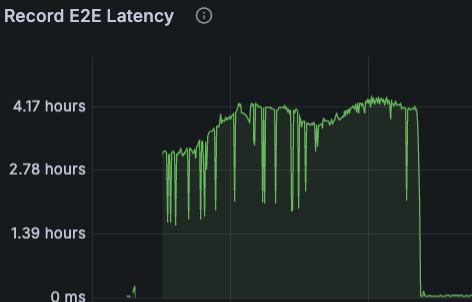
The usual suspect was, of course, lagging topics. A quick look at our dashboards revealed the issue - extremely high lags in the input topics of one of the applications in the pipeline. A deeper dive into our advanced troubleshooting dashboards revealed high end-to-end (E2E) record latency - from a couple of minutes on average up to 4 hours in the worst cases.

In addition to the high lags and processing time, we noticed an increase in the following metrics:
- Number of messages per second on two of the application’s input topics.
- Application’s pods restarts.
- Number of Kafka consumers rebalance events.
- CPU and memory utilization.
The conclusion was rather clear - the application simply could not keep up with the increase in the number of messages ingested into the pipeline.
Our go-to solution was to scale the application up. We increased the number of application instances, but as the number messages continued to grow, lags have started to accumulate again. At some point we reached the max parallelism that Kafka Streams supports, which is dictated by the number of partitions on the input topic. It was at this point that we understood the issue we’re dealing with is deeper than it looks.
Kill 'em Lags
The lagging application was impacting our users and our committed SLA, so we needed to find a solution quickly. Though we did have experience with Kafka (and Kafka streams) configuration tuning, we could not afford spending time on trying different configurations until we hit the jackpot. We decided it was time to ask for help, and who would be a better candidate than the people that eat, sleep, and breathe Kafka streams?
Along Came Responsive
Responsive is a company that improves the reliability, scalability and operability of Kafka Streams applications by replacing the underlying architecture with a more robust platform. Their team of Kafka contributors and committers examined the context of our application, and identified the most relevant attributes:
- The application is stateful, but does not make any calls to systems outside of Kafka and AWS EBS
- It runs on kubernetes as a StatefulSet (which prevents node restarts from triggering unnecessary rebalances) and is configured with a memory-based HPA (correctly tuned to scale the number of nodes to the maximum number of partitions divided by the number of stream threads)
- The entire pipeline needs to process approximately 70k records/second during peak hours
We engaged their team with consulting sessions to increase the application’s throughput so that it can keep up with the input rate. We did also understand that there may be a fundamental limit to what we can achieve with our current partitioning strategy: 60k records/s over 30 tasks is 2000 records/s/partition (or 0.5ms/record), which makes a very tight end-to-end latency requirement.
There were two main issues that had to be tackled in order to meet our goals:
- We needed to increase the processing rate so that steady state processing could keep up
- We needed to stabilize our partition assignment so we could effectively utilize our resources and prevent disruption from steady state
These could (and should!) be addressed separately.
Increasing Processing Rate
Attempt 1: Increasing Parallelism
When discussing processing rate in Kafka Streams applications, the num.stream.threads config controls the number of threads for stream tasks and is the first config to tune (see Responsive’s guide on performance tuning). More threads increase parallelism, but increasing threads beyond the number of stream tasks doesn't help, as idle threads will be created. The maximum number of stream tasks is determined by the number of partitions across the source topics per sub-topology (see the excellent architectural documentation for Kafka Streams). To calculate the max number of tasks, sum the maximum partitions across all sub-topologies:
max_number_of_tasks =
  max(sub_topology_1_topic_1_partitions, ... sub_topology_1_topic_n_partitions)
  + …
  + max(sub_topology_n_topic_1_partitions, ... sub_topology_n_topic_n_partitions)
Our application has two subtopologies, which read from topics with 30 partitions, so our max level of parallelism was 60. Having spawned 30 instances, that meant each instance could have no more than two stream threads. However, we didn’t take that into account when we scaled the application up, so in our code num.stream.threads was set to 4, meaning half of the stream threads were idle at any given time.
Stream threads consume memory and CPU, and spawn multiple OS threads under the hood. Having a couple of redundant threads is not that bad, but having double the maximum number of stream tasks - well, that’s a different story. We were suspecting the memory and CPU overhead of allocating so many threads might have affected the application’s processing rate. We’ve changed num.stream.threads to 2, but unfortunately, the processing rate and lags remained more or less the same. We had to pursue a different direction.
Attempt 2: Improved Caching
Since the application’s topology is not that complex and consists mostly of simple statistical computations, we suspected that a significant amount of CPU cycles were spent on data serialization and reading/writing to Kafka topics and state stores. Since improving the efficiency of serialization/network access is hard (if at all possible), we decided to improve the processing rate by reducing read/write operations to Kafka changelog topics and to the state stores.
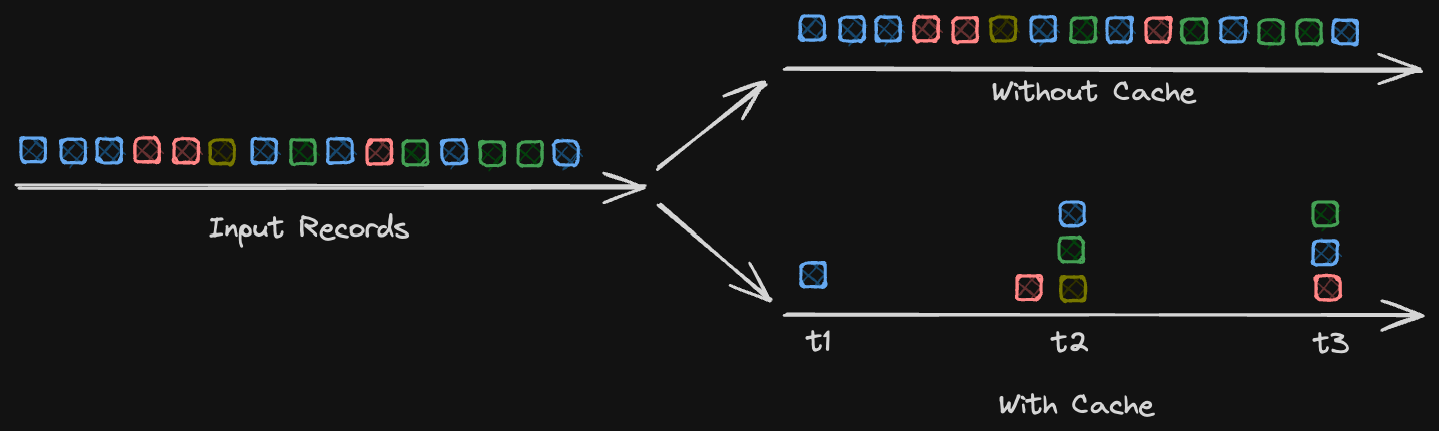
To achieve that, we increased the size of the in-memory Record Cache. The record cache is used for internal caching and compaction of output records before they are written to the underlying state store or being forwarded to downstream processor nodes. For every record processed by some processor node, Kafka streams checks if a record with the same key already exists in the record cache, and if so it overrides the value of that key with the new value. When the cache gets full (or the commit interval expires) the cache is flushed and the most up-to-date version of each key in the cache gets forwarded to the next downstream processor node (and written to the changelog topic).
The figure below shows the difference between running with and without the record cache:
Benefit 1: Improved Throughput
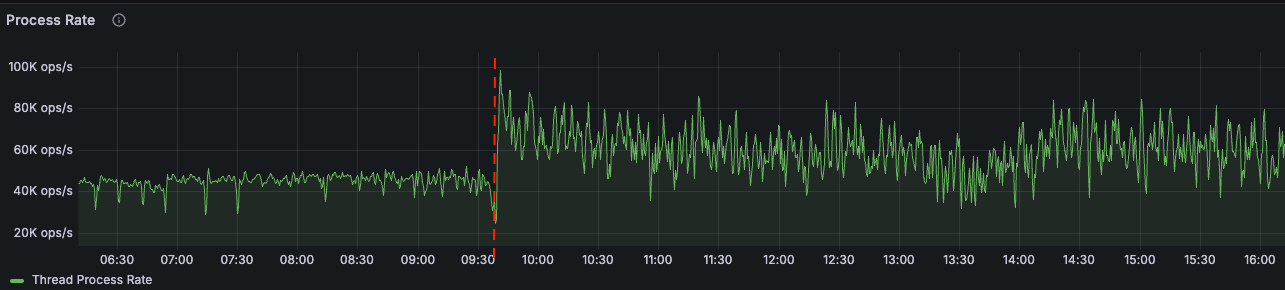
The record cache size is controlled by the statestore.cache.max.bytes setting, and defaults to 10MB, which is rather low for applications that process tens of thousands of records per second. This would mean fewer disk lookups and fewer network calls to hit EBS. We decided to increase the cache size to 200 MB and the results were quite satisfying. The first thing we noticed was the increase in thread process rate:
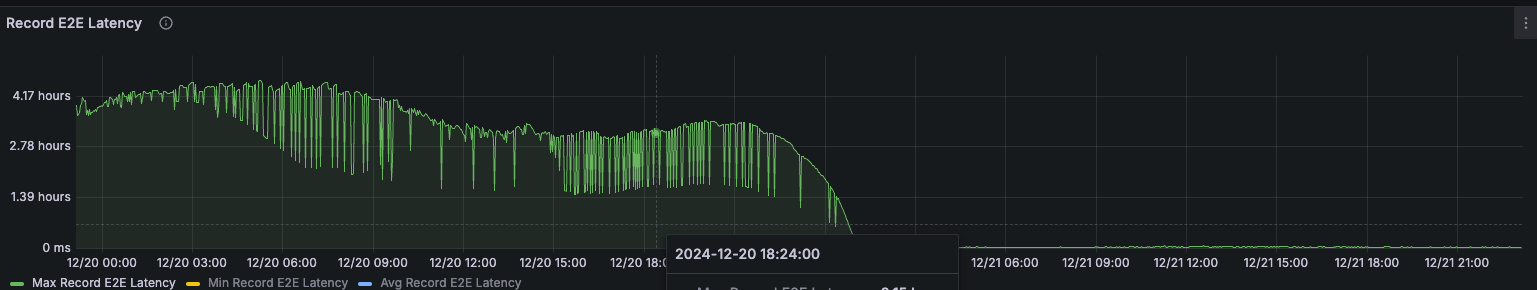
The second thing we noticed, which was related to the delayed updates in the System Inventory, was a sharp decrease in the end-to-end record processing latency:
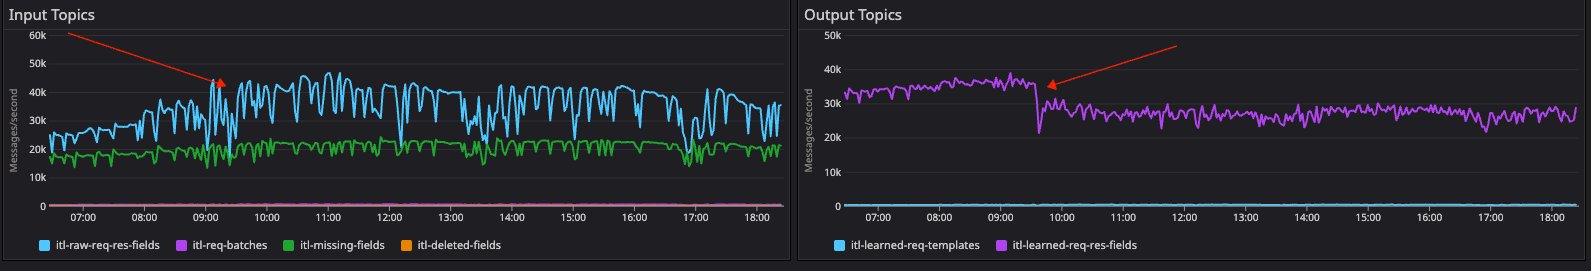
Benefit 2: Reduced Downstream Pressure
Another cool side effect we observed was a decrease in the output rate of the application. Why did that happen? Kafka Streams follows a principle called “continuous refinement” - instead of outputting a single record when an aggregation “finishes” (which in a continuous aggregation may never happen) it outputs a record whenever the value of the aggregate changes. Imagine an aggregate that counts the number of a certain key in an input topic, after seeing the first record for key “A” it outputs “keyA, value: 1”, when it sees the second it outputs “keyA, value: 2”, so on and so forth…
The thing about Kafka Streams is that changing the cache size decreases the frequency at which this output is refined. This means that instead of outputting a record for every input, it will cache the output until either the commit interval is hit or the cache is filled - so you may output 1 record for every N input records.
Why is this cool? Because that way we reduced the load on the other applications in the pipeline!
Reducing Rebalance Frequency and Stabilizing Partition Distribution
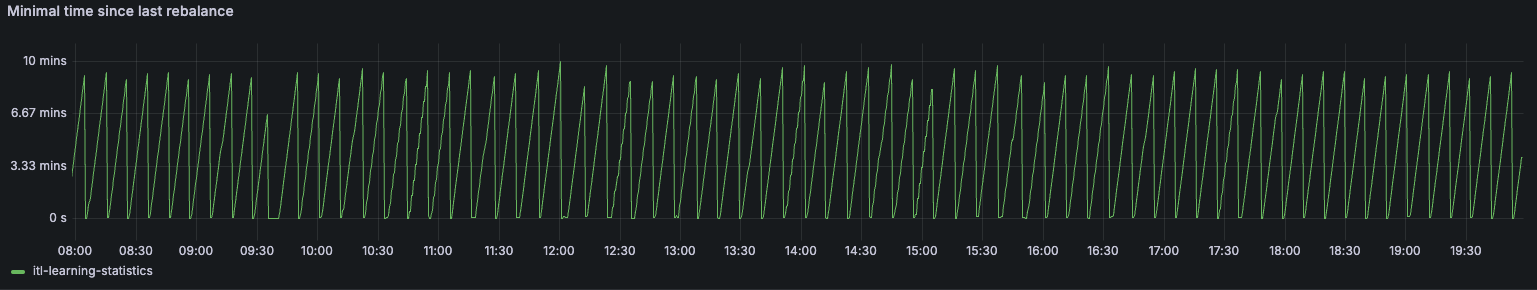
With the improved processing rate and the decreased end-to-end record processing time, we were ready to tackle the rebalancing issue. The first sign of concern was the following graph, which indicated we were rebalancing… every ten minutes!?
At first, we were concerned that this meant state was shuffled around between nodes every ten minutes – which would be a clear no-go for applications with significant state, as was the case with ours. A shuffle of state would not only cost us in terms of network bandwidth, but it also triggers a block of time where a task is “restoring” and cannot make progress. During these rebalances, lag would build up significantly.
Thankfully, this was not what was happening. Examining the logs revealed the real cause behind these frequent rebalances:
Requested to schedule next probing rebalance at {} to try for a more balanced assignment
It was not caused by failures, evictions or other situations that would cause the state to shuffle. Instead, it was caused by what’s called “probing rebalances” (see this blog for all the gory details of the rebalancing protocol).
To understand this, we have to first explain how Kafka Streams parallelize processing among the different application instances:
Kafka uses the PartitionAssignor to determine how topic partitions are distributed among consumers. Kafka Streams has its own implementation of the PartitionAssignor, called the StreamPartitionAssignor which attempts to distribute the work as evenly as possible, but also takes into account aspects such as minimizing state transfer/keeping tasks on the same threads.
There is one additional, and important, restriction of the StreamsPartitionAssignor: it only attempts to assign a (stateful) task to stream threads that have a full copy of the state that belongs to that task. If the partition assignor decides to move some task from one stream thread to another, it must first make sure that the latter has fetched a complete copy of the relevant state (until that happens processing continues on the original stream thread).
To achieve this, the partition assignor places special tasks, called Warmup Tasks that, rather than actively processing data, simply copy the required state from the relevant changelog topics until enough state has been copied.The assignor then leverages the rebalance protocol to communicate information about whether those tasks are “caught up” by scheduling a recurring rebalance that is used to probe the readiness of these warmup tasks. Can you guess the frequency that these rebalances are scheduled? You got it: every 10 minutes.
While probing rebalance is not a bad thing on its own, if it happens constantly, it means that the assignor is not able to distribute the tasks evenly. This usually happens when the warmup tasks are not able to keep up with the rate at which new state is written to the changelog topics. There are things that can be done to help the warmup tasks copy the state faster:
- Spawn more of them, so the burden of copying the massive amount of state from Kafka is shared by more tasks (i.e. gets more parallelized).
- Increase the value of
acceptable.recovery.lag(that defines when enough state has been fetched).
Since we deal with an extremely large state, we decided to change both of these settings. The number of warmup replicas was increased from 2 to 4, and the acceptable recovery lag from 10K records to 500K. After applying these changes, the probing rebalance finally stopped and the application was finally stable again.
Wrapping Up Our Learnings
We’ve learned a couple of important lessons throughout this interesting journey of troubleshooting and solving the lag and performance issues we’ve been experiencing:
- It’s not enough to monitor the basic metrics (like lag or pod restarts). While they are the first thing that you might notice, it’s the more in-depth metrics (like processing/rebalance rate) that tell the full story, and sometimes diving deep into the logs is necessary to make sense of the metric anomalies.
- While Kafka Streams is built on top of Kafka, it has its own unique nuances (mostly related to stateful processing). It is crucial to be aware of them, and take them into account.
- When it comes to extremely high scale and load, a small tweak in configuration can yield a massive improvement in processing rate.
- Good consultation can save you a lot of time (and money)!
Subscribe to learn more about Kafka Streams
Omer Aharonian
Staff Software Engineer, Salt Security