
Last Updated: Apache Kafka version 4.0 and Responsive SDK version 0.39.0
Learning Objective: After this Kafka Streams 101 lesson, you will understand how Kafka Streams uses memory, what symptoms indicate that your application doesn’t have enough available memory, and how to configure Kafka Streams to use memory appropriately.
How Kafka Streams uses Memory
The first thing to understand is how exactly Kafka Streams uses memory. We can break down memory usage into the following categories:
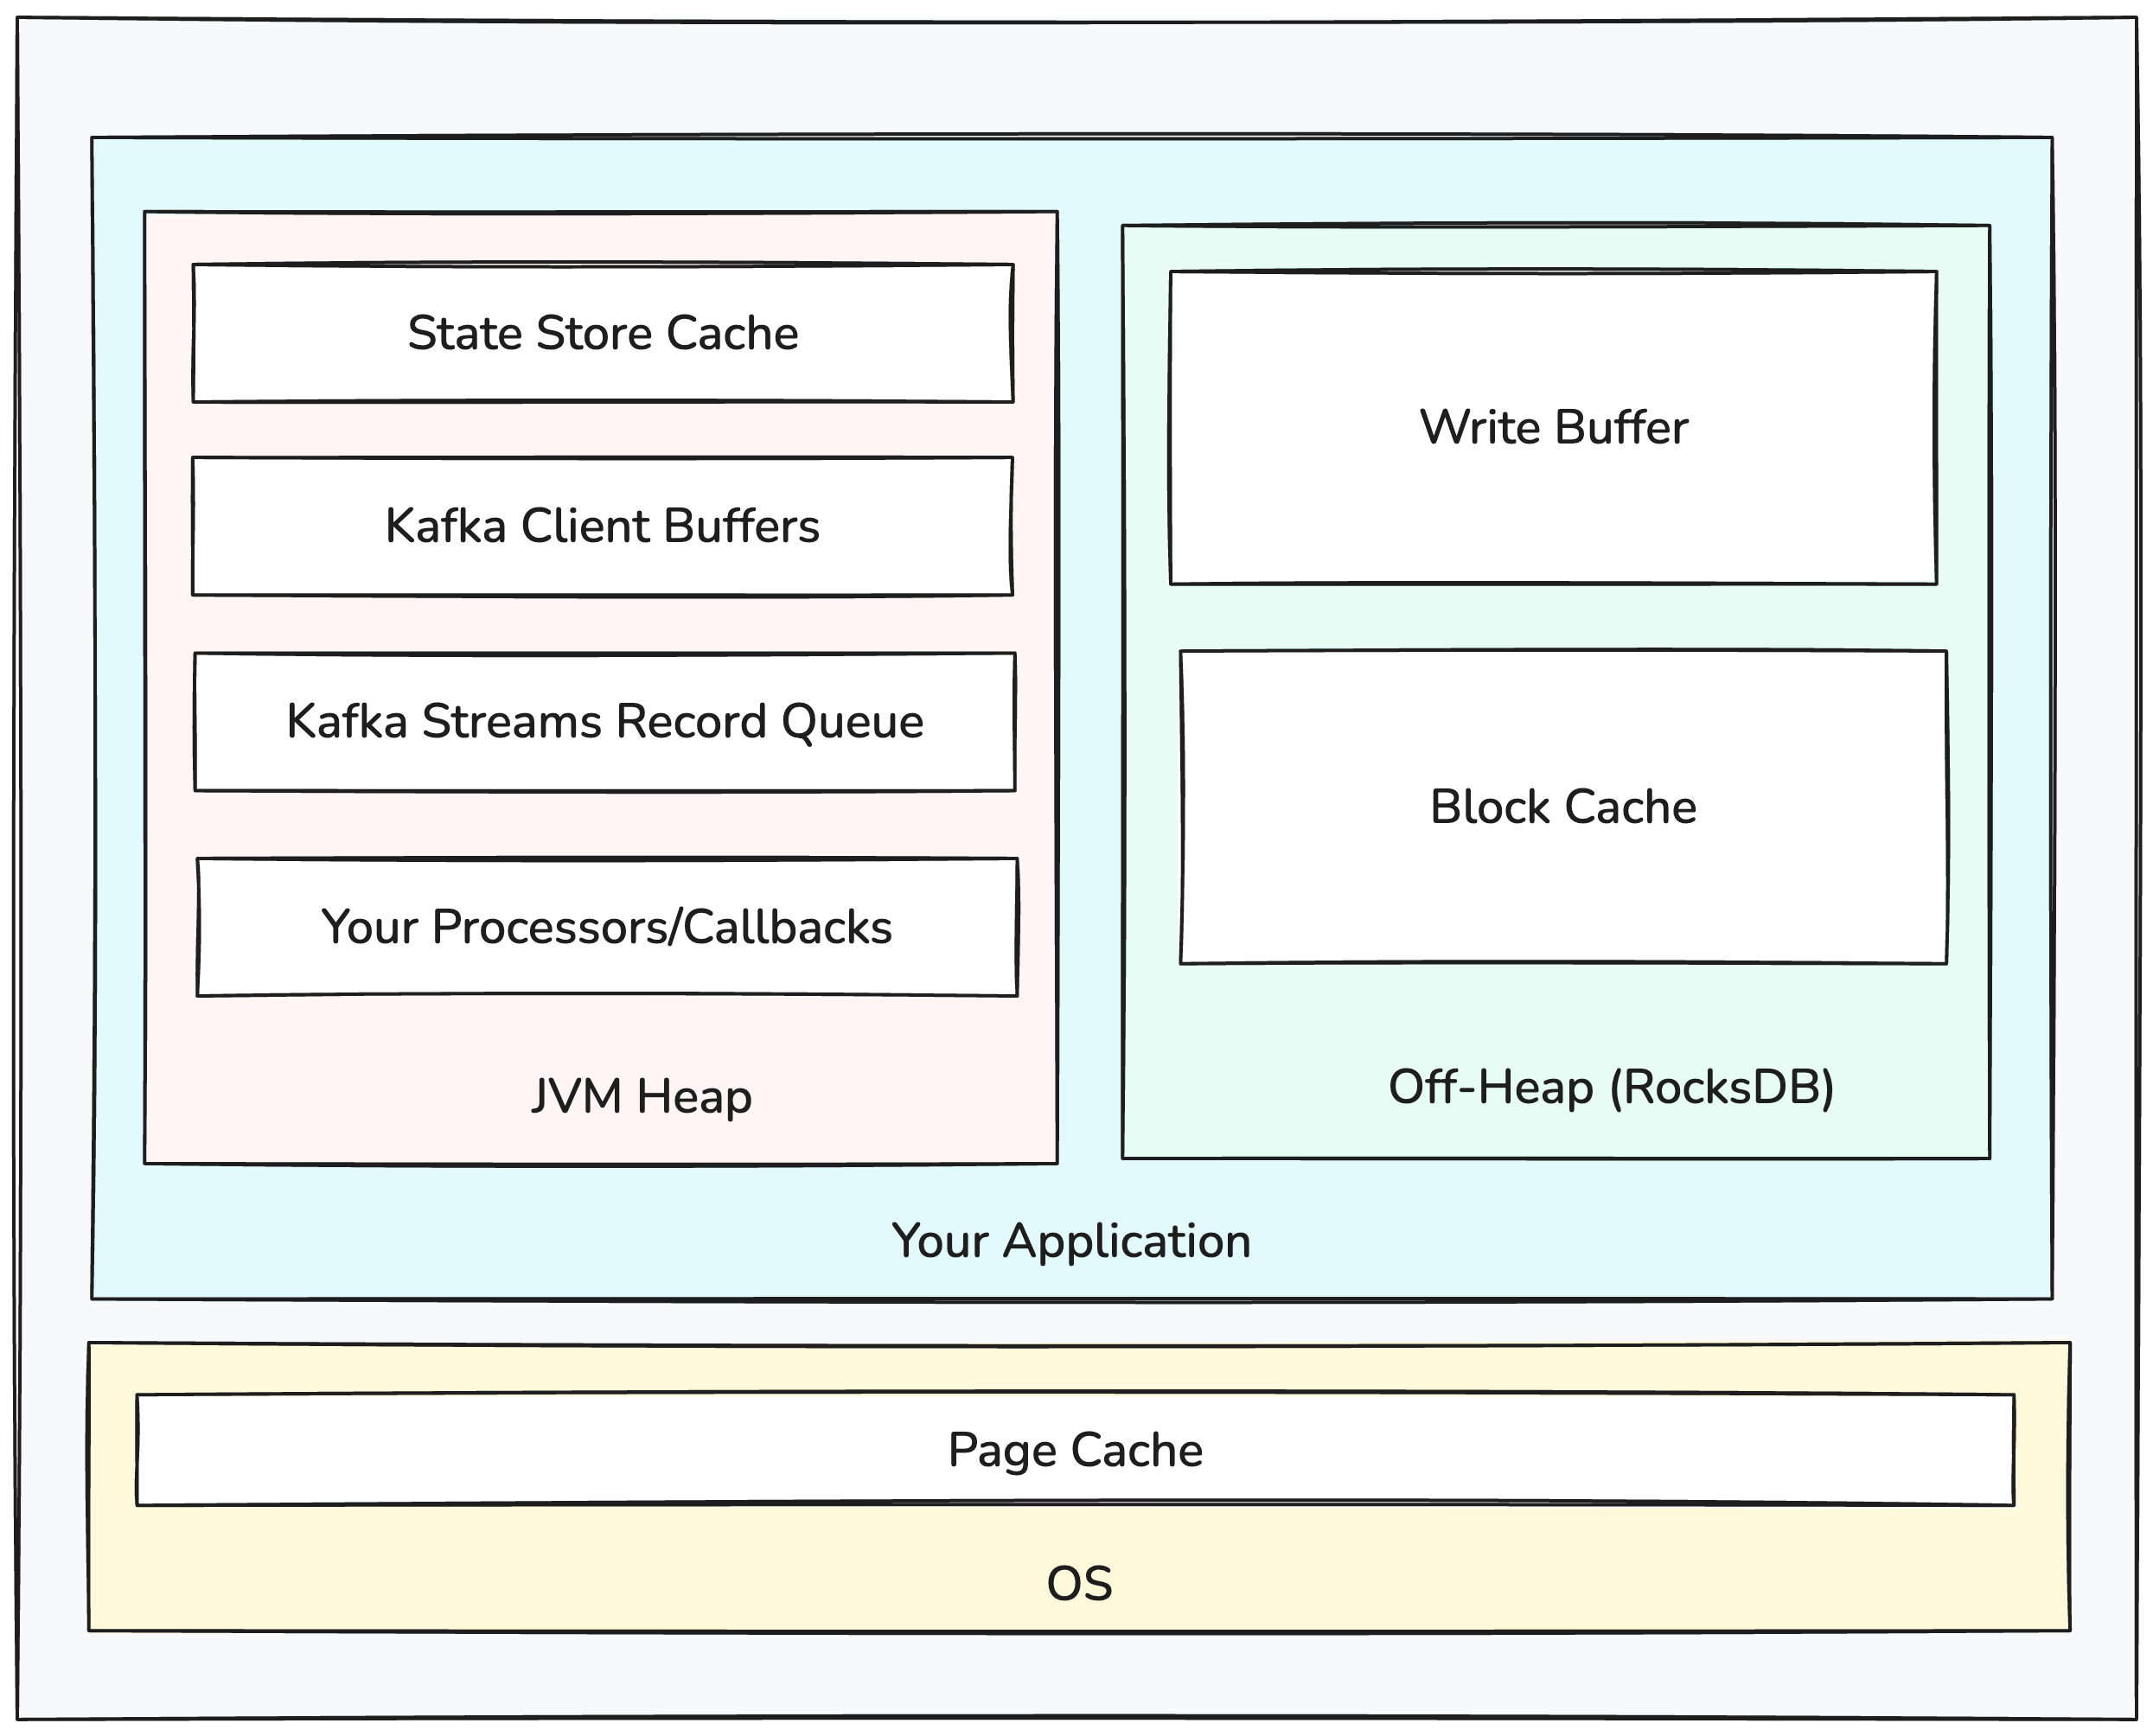
Heap: Allocations done by the JVM on the Java heap to run your application.
Off-Heap: Allocations done by native code of memory outside the Java heap.
Page Cache: Memory used by the OS to cache data from files on disk.
Heap
The Java Heap is where memory is allocated for Java objects. For a Kafka Streams application, the primary users of heap memory are:
Record Cache: Kafka Streams maintains a cache of data written to and read from state stores. For DSL aggregation KTables and source KTables, this cache also works to compact intermediate results so that they’re only forwarded to downstream operators as needed when the cache fills or a task is committing.
Suppression Buffer: If you use the suppress operator, Kafka Streams holds intermediate results in-memory until the suppression window for each key until it closes. There is no practical limit on the number of keys, so this buffer can grow arbitrarily large if you don’t bound it.
In-Memory State Stores: If you use any in-memory state stores, all the state store state will be allocated on the JVM heap.
Kafka Streams Partition Buffer: Kafka Streams maintains a per-task queue of records that have been returned by poll and are awaiting being processed.
Kafka Client Buffers: The Kafka Clients maintain their own buffers of data received from and sent to Kafka. The Consumer holds a buffer of records that have been fetched from brokers but not yet consumed by poll. The Producer also has its own buffer of records waiting to be sent to the brokers in batches.
Your Processors/Callbacks: Your PAPI processors and the callbacks you pass to DSL operators are just java code, so they can allocate whatever memory they want/need to perform their function.
Off-Heap
Native code allocates system memory directly. There are lots of minor off-heap memory allocations (network send/recv buffers, jvm overhead, etc), but by far the main consumer of off-heap memory for a Kafka Streams application is RocksDB. Internally, RocksDB allocates memory for:
Write Buffer: RocksDB buffers puts/deletes in-memory until enough data is accumulated, at which point the accumulated writes are flushed to disk.
Block Cache: RocksDB maintains its own cache of uncompressed SST blocks (chunk of key-value pairs, or metadata blocks like indexes and bloom filters).
Bloom Filters: RocksDB stores data in files called SSTs, and each SST contains a bloom filter that’s used to include/exclude the file when searching for keys. By default, these filters are all cached in-memory.
SST Index: Each SST also contains an index that’s used to find where in the SST a given key might reside. By default the indexes are all stored in-memory separate from RocksDB’s block cache.
Page Cache
Finally, the OS will use any memory not in use by running programs to cache on-disk data in the page cache. This is critical for improving the performance of stateful applications by avoiding hitting disk for RocksDB reads. You generally don’t need to worry about this from a “running out of memory” perspective, but it’s important to be aware of as having enough cache is important for performance. Remember, any memory that’s not allocated by the JVM or RocksDB (or other processes) can be used for page cache. So you usually want to leave some room for the page cache if you have a stateful application. How much will depend on your app. The tradeoff is that the page cache can store more data as its storing compressed pages - so you’ll likely need to access disk less frequently. But it’s more expensive to read from page cache than the block or record cache because it requires a system call and the data must be decompressed.
Running Out Of Memory
What does it look like when Kafka Streams doesn’t have enough available memory? The answer depends on what kind of memory you’re running out of.
Running out of Java Heap
If you allocate too many objects and cause the Java heap to grow to its maximum size, the JVM throws a java.lang.OutOfMemoryError . With Kafka Streams, this can happen if your max heap size is too small, you’ve given too much memory to the record cache or client/streams buffers, your app is holding too much state in in-memory stores or suppression buffers, or you’re allocating too much memory from your processors.
Running out of System Memory
If your application tries to allocate too much system memory, the application can fail in a few different ways:
- An allocation could fail, in which case you might see a fault from RocksDB or a
java.lang.OutOfMemoryError. - More typically, you will observe that your application is terminated:
- The OS may terminate your application by sending it a KILL signal. This can happen if the programs running on the OS attempt to allocate more memory than is available, or, if you’re using cgroups (which is the default in modern linux versions, and as kubernetes does when you set a container resource limit), your application tries to allocate more memory than its limit. Cgroups are how linux enforces memory limits for processes. You can discover this happened by using
dmesgto read the kernel log and looking for a message like[1852922.050402] java invoked oom-killer: gfp_mask=0xcc0(GFP_KERNEL), order=0, oom_score_adj=0 [1852922.227054] oom-kill:constraint=CONSTRAINT_MEMCG,nodemask=(null),cpuset=/,mems_allowed=0,oom_memcg=/limited_group,task_memcg=/limited_group,task=java,pid=30862,uid=0 - If you’re running on Kubernetes, and the total memory usage on a node is approaching the system limit, Kubernetes will evict pods that are using more memory than they’ve requested (more on this later).
- The OS may terminate your application by sending it a KILL signal. This can happen if the programs running on the OS attempt to allocate more memory than is available, or, if you’re using cgroups (which is the default in modern linux versions, and as kubernetes does when you set a container resource limit), your application tries to allocate more memory than its limit. Cgroups are how linux enforces memory limits for processes. You can discover this happened by using
The total memory allocated by Kafka Streams is the sum of heap and off-heap memory usage. So this can happen if your heap size plus the memory allocated by RocksDB is too high.
Poor Performance
It’s also possible that there is enough memory to satisfy allocations, but you see poor performance:
- You might not have enough cache allocated, so Kafka Streams is forced to flush updates prematurely, or go to RocksDB for reads (which can be expensive as it crosses the JNI boundary).
- You might not have enough block cache allocated to RocksDB so it’s forced to read blocks from disk. This is expensive because the reads might have to block on I/O, they have to be served via a system call, and need to be decompressed.
- You might not have enough system memory to allow for enough data to be cached in the page cache, which means more reads have to block on I/O.
- Your heap size might be too small, which puts pressure on GC. In general, a smaller max heap size means that GC needs to run more frequently, which reduces throughput and/or increases tail latencies.
Configuring Kafka Streams
To avoid the above problems, you’ll need to configure Kafka Streams to set the appropriate limits on memory usage from the various components. In this section we’ll go over the relevant settings. For the most part, this section rehashes the Kafka Streams documentation on bounding memory.
Your basic approach should be to first set bounds so that the application is stable and doesn’t run out of memory. From there, you can look to adjust the sizes of the various components’ allocations to improve performance. Our capacity planning/sizing guide has more information on how to do the latter.
Heap Memory
JVM Heap
You’ll need to decide how much memory to allocate to the JVM heap vs to off-heap memory allocations from RocksDB. You can set this max heap size using the -Xmx JVM parameter.
Kafka Streams Configuration
Next, you should make sure the Kafka Streams components described above are capped to use less than the max JVM heap - or equivalently - that your JVM heap is sized using the -Xmx parameter to accommodate the usage from the various components. You can compute the sizes of and set bounds to the various components as follows:
Record Cache
To bound the Record Cache, you need to set the statestore.cache.max.bytes config property. It sets the max bytes to use for record cache.
This setting applies across all threads. So if you set this value to 400MB (419430400), and there are 4 stream threads, then each thread will have its cache limited to 100MB. When the cache grows to this limit, Kafka Streams evicts records and writes them to the underlying state store (and its changelog topic). For DSL aggregates and source KTables, Kafka Streams also forwards the result to downstream operators.
Its default value is 10MB, which is quite conservative. You’ll generally want to allocate more cache to achieve good performance — just make sure its accounted for in your max heap size.
Suppression Buffer
To bound a Suppression Buffer, you need to pass KTable#suppress a Suppressed instance with a BufferConfig that has its max bytes set to the desired bound. For example, to configure a suppression that tries its best to wait 5 minutes for additional rows, but emits some results early if the suppression buffer is larger than 1MB you could do:
myKTable.suppress(
    Suppressed.untilTimeLimit(
        Duration.ofMinutes(5),
        Suppressed.BufferConfig.maxBytes(1024 * 1024).emitEarlyWhenFull()
    )
)
The behavior of the operator when it hits the bound depends on the type of suppression semantics you request:
- If you use
untilWindowClosesto request a guarantee of a single result per window, then the operator requires a strict buffer config - meaning you have to use the shutDownWhenFull buffer-full strategy. In this case, Kafka Streams initiates a clean shut down when the buffer reaches its size threshold because it cannot evict anything from the buffer without breaking the requested semantics. This is still preferable to crashing on out-of-memory as a clean shutdown will avoid a potentially expensive restore for your application’s state stores when you’re able to restart the application with a larger heap. - If you use
untilTimeLimit, then you can ask Kafka Streams to simply emit rows early when the buffer fills by using theemitEarlyWhenFullstrategy as shown in the example above.
Note that the bound you specify here is specific to a single task. So the effective memory limit when setting a bound is the configured bound multiplied by the number of tasks that run the operator.
Bounding In-Memory State Stores
It’s not possible to bound the size of in-memory state stores. They will simply try to store whatever data has been written to the store in JVM memory. So be careful when using them and make sure that the total size of the store in combination with other memory usage does not cause you to exceed the max heap size. If you’re finding that your stores are growing too large, it’s safe to just change to a persistent store.
Kafka Streams Partition Buffer
After each call to poll, Kafka Streams enqueues records on a per-partition queue to await processing. You can’t set a bound for the enqueued records in bytes, but you can bound the number of queued records using the buffered.records.per.partition config property.
This property sets the max number of records that can be buffered for a single partition. As there’s no limit to the number of partitions that can be assigned to a single instance, the effective limit for the total number of buffered records is the value of this property multiplied by the number of partitions. There is no way to set this property on a per-partition basis, so the configured limit applies to all partitions. So, for example if you have one subtopology that processes 100KB records, and another subtopology that processes 10KB records, its not possible to use a different value for tasks from the two subtopologies.
The default value buffered.records.per.partition is 1000. In most cases you don’t need to worry about this config, but if you have particularly large records then setting this gives you a knob to control memory usage from record buffering.
Kafka Producer
Each Kafka Producer maintains a buffer of records that have been accepted by send but have not yet been sent to the brokers. You can bound the size of this buffer using the buffer.memory property. When the total size of buffered records exceeds this limit, the producer blocks further calls to send until the buffer has been cleared by sending the data to Kafka. Note that this is a per-producer configuration. So in almost all cases the total memory usage from producer buffers will be the value of this property multiplied by the number of Stream Threads. If you’re using EOSV1 (which you shouldn’t be!), Kafka Streams creates a Producer per-task, so the total usage would be the property multiplied by the number of tasks.
The default value is 32MB. As this is a pretty low limit, you generally shouldn’t need to worry about it.
Kafka Consumer
The Kafka Consumer maintains a buffer of records that have been received from Kafka brokers, but not yet returned from poll. There isn’t a direct way to limit the bytes or number of records held in this buffer. One approach is to use the max.partition.fetch.bytes property. The consumer will hold at most one fetch result per partition in memory, so the max memory required for a given consumer is the number of partitions multiplied by the value of this property.
Off-Heap Memory
The primary allocator of off-heap memory is RocksDB. By default, Kafka Streams doesn’t take much care to limit the memory used by RocksDB. Each store can allocate:
- Write Buffers: RocksDB accumulates writes in a Write Buffer, and then flushes the whole Write Buffer to disk. While a given Write Buffer is being flushed, new writes are written to a new Write Buffer. Kafka Streams limits RocksDB to 3 16MB Write Buffers (one active, and up to 2 being flushed).
- Block Cache: RocksDB caches SST blocks in its own cache. By default, Kafka Streams configures this cache to take up to 50MB.
- Bloom Filters: RocksDB stores all bloom filters in memory. By default, there is no limit on the memory required to store the filters.
- Index: RocksDB stores all SST indexes in memory. By default, there is no limit on the memory required to store the indexes.
And that’s per State Store! So if you have a node assigned multiple stateful tasks (which can each run multiple stores), each of the created stores will perform these allocations.
To limit this memory usage you’ll need to write an implementation of RocksDBConfigSetter , and pass it to the rocksdb.config.setter config property.
RocksDB has a rich set of configuration properties and APIs for tuning the memory usage. You can set limits on the cache size, write buffer size, limit the number of cached bloom filters/indexes by limiting the max open files, and more. Rather than giving you an exhaustive list of options here, we’ll go over a good general-purpose recommendation. If you’re interested in the gory details of all the different possible config properties you can find that in the RocksDB documentation.
Use a Shared Block Cache
Our first tip is to use a shared block cache for all the state stores on a given node. You could also share the block cache for some other grouping (like all the stores for a given KTable), but by using a single block cache you can set a node-level memory limit. To do this you need to create a static instance of org.rocksdb.LRUCache with your desired maximum size, and set it in the options passed to setConfig.
Cache Indexes/Filters in Block Cache
Next, configure RocksDB to store indexes and filters in the block cache. This way the memory used to store these structures is bounded by the cache size. You can also configure the cache to store these entries with higher priority by (1) reserving some fraction of the cache space for high priority entries (see the LRUCache constructor), and (2) setting the cacheIndexAndFilterBlocksWithHighPriority option on BlockBasedTableConfig.
Account Write Buffer from Block Cache
You should configure RocksDB to account Write Buffer memory from the Block Cache. This won’t actually store Write Buffers in the block cache. Rather, it tells RocksDB to count the bytes allocated for Write Buffers against the Block Cache size so that the Block Cache size becomes a total limit on memory used for both writes (from Write Buffer) and reads (from cache entries). To do this you need to:
- Create a static
WriteBufferManagerinstance and pass the static block cache to its constructor. - Pass the
WriteBufferManagerto the options by callingsetWriteBufferManager.
Use jemalloc
Additionally, on Linux systems we recommend running Kafka Streams using the jemalloc allocator rather than using the system default due to some quirks with the way the shared cache interacts with Kafka Stream thread replacement (this blog I wrote has all the gory details). To do this you need to install jemalloc on your system and then use the LD_PRELOAD environment variable to load the library at runtime. For example, on an x64 debian system you would do:
$ apt install -y libjemalloc-dev
$ LD_PRELOAD="/usr/lib/x86_64-linux-gnu/libjemalloc.so” <command to run your app>
💡 A note on Kubernetes If you’re running Kafka Streams on Kubernetes, we recommend carefully reading the Kubernetes documentation on pod QOS classes and setting your resource requests/limits accordingly. Further, if you’re using EOS and have large state stores, we recommend setting explicit memory and cpu requests and limits for your containers, and setting the limit to be the same as the request. By doing this, K8s will categorize your containers into the “Guaranteed” QOS class, which minimizes the likelihood that K8s selects your Kafka Streams containers for eviction on node pressure, which can result in long restores.
Examples
You can find a full example of the techniques described in this post here: https://github.com/responsivedev/bounded-memory-example/tree/main/app/src/main/java/dev/responsive/boundedmemoryexample
There are also some other great community examples/references:
- Apache Kafka’s documentation on bounding Kafka Streams memory.
- ksqlDB’s implementation of
RocksDBConfigSetter.
Observing Memory Usage
Once you’ve configured Kafka Streams to keep memory usage in check, you’ll want to be able to monitor usage to make sure it stays within the bounds you’ve set up. In this section, I’ll go over the various metrics you can use to do this.
Heap vs Off-Heap vs Page Cache
Your first step will typically be to try to assess how much memory you’re using for the JVM heap vs off-heap allocations vs page cache.
You’ll first need to understand how much memory is allocated vs how much is used for the page cache. How you do this varies by system. For example, on Linux you can use the free and ps (look at the RSS column) tools to get to the page cache usage and process memory usage, respectively.
Next, you’ll want to figure out the heap size of your JVM. One way to do that is using the jcmd tool.
Here’s an example:
$ free -mh
               total        used        free      shared  buff/cache   available
Mem:            15Gi       3.5Gi       5.0Gi       6.0Mi       7.0Gi        11Gi
$ ps aux
admin           8 54.1 13.1 7616704 2125456 ?     Sl    2024 73388:59 java ...
$ ./jdk-21.0.5/bin/jcmd 8 GC.heap_info
8:
 garbage-first heap   total 1632256K, used 915928K [0x0000000717000000, 0x0000000800000000)
  region size 2048K, 229 young (468992K), 18 survivors (36864K)
 Metaspace       used 69464K, committed 70016K, reserved 1114112K
  class space    used 6766K, committed 7104K, reserved 1048576K
This tells me that I’m using 7GiB for page cache, my total memory allocated to my app is ~2GiB, its heap size is ~1.6GiB, and so my off-heap allocations are ~500MiB.
Memory Used by Kafka Streams Components
Now let’s go one level down. Kafka Streams offers a number of metrics to help you understand both the on-heap and off-heap memory usage from the various components described above:
Kafka Streams
| Metric | MBean | Description |
|---|---|---|
| active-buffer-count (DEBUG only) | kafka.streams:task-id=”{task id}”,thread-id={”thread id}”,type=stream-task-metrics | Reports the number of records currently held in the queue for a given task. |
| cache-size-bytes-total (DEBUG only) | kafka.streams:task-id=”{task id}”,thread-id={”thread id}”,type=stream-task-metrics | Reports the current usage in bytes of the cache from a given task. |
RocksDB
| Metric | MBean | Description |
|---|---|---|
| num-immutable-mem-table | kafka.streams:rocksdb-state-id=”{store id}”,task-id=”{task id}”,thread-id=”{thread id}”,type=stream-state-metrics | Reports the number of memtables that are awaiting flush (but have not finished flushing). |
| cur-size-active-mem-table | kafka.streams:rocksdb-state-id=”{store id}”,task-id=”{task id}”,thread-id=”{thread id}”,type=stream-state-metrics | Reports the current size (in bytes) of the active memtable. |
| cur-size-all-mem-tables | kafka.streams:rocksdb-state-id=”{store id}”,task-id=”{task id}”,thread-id=”{thread id}”,type=stream-state-metrics | Reports the current total size (in bytes) of the active and immutable memtables (those awaiting flush). |
| size-all-mem-tables | kafka.streams:rocksdb-state-id=”{store id}”,task-id=”{task id}”,thread-id=”{thread id}”,type=stream-state-metrics | Reports the current total size of all memtables held in memory. In addition to the active and immutable memtables, RocksDB also holds memtables pinned by iterators in-memory until the iterators close. |
| block-cache-usage | kafka.streams:rocksdb-state-id=”{store id}”,task-id=”{task id}”,thread-id=”{thread id}”,type=stream-state-metrics | Reports the current size of the block cache in bytes. |
| block-cache-pinned-usage | kafka.streams:rocksdb-state-id=”{store id}”,task-id=”{task id}”,thread-id=”{thread id}”,type=stream-state-metrics | Reports the current number of bytes from entries in the block cache that are pinned by iterators. These entries cannot be evicted until the iterators close. |
Kafka Producer
| Metric | MBean | Description |
|---|---|---|
| buffer-total-bytes | kafka.producer:client-id=”{client id}”,type=producer-metrics | Reports the total bytes that the producer can allocate for its send buffer. |
| buffer-available-bytes | kafka.producer:client-id=”{client id}”,type=producer-metrics | Reports the total bytes that the producer can allocate for its send buffer, but are not being used. |
Conclusion
Kafka Streams memory management is nuanced because you have so many different memory zones, both on-heap and off-heap, each with their own limits. Violating boundaries can slow you down or even kill you app. There are so many different tools and metrics to understand the different memory pools, and a variety of configurations to tune each one. What’s more, each tuning affects the others and it’s a delicate dance to get to an optimal setup.
You likely noticed that it’s especially challenging to configure state stores to respect memory bounds. If you are constantly working on tuning memory in Kafka Streams, consider moving state off of the application nodes into a remote data store. This simplifies the problem by splitting it in two and letting you sidestep the challenge of dealing with state store memory management in your application. Further, scaling operations with disaggregated state also become simpler since app nodes are stateless. This means it’s much easier to allocate more memory capacity at will, making fine tuning less necessary. The Responsive SDK is the simplest way to disaggregate state stores from Kafka Streams nodes, so do check it out if you think a disaggregated state approach would work better for your application.
Subscribe to be notified about the next Kafka Streams 101 lesson
Rohan Desai
Co-Founder